ANNUAL REPORT ‘12
ECONOMIC AND REGULATORY ENVIRONMENT
31
despite the crisis, international tourism surpassed
one billion passengers, the highest number ever.
According to estimates by the World Tourism
Organisation (WTO) international air transport
will grow by 5% in 2012, boosted by the growth of
international traffic in the Middle East and Latin
America. Domestic air transport is expected
to decrease, with China being the only economy
that continues to have strong growth in that
market.
The figures for air freight are not as encouraging, with
declines being recorded for the second straight year.
This trend is explained by this sector’s heavy depend-
ence on the macroeconomic situation and develop-
ments in world trade, which is now concentrated on
emerging economies more than on those of the USA
or Europe.
This environment of strong competition between
airlines, associated with the change in their business
models and in air transport trends, has placed growing
pressure on airport operators. The adaptation of air-
port infrastructures to make them more efficient with
a lower operating cost has been one of the market
requirements. One illustration is the way low-cost
airlines burst into the market. Infrastructures had to
be adapted to their needs, in particular to be able to
respond to the shorter turnaround times of the
aircraft, which is characteristic of their operations. But
many of these companies chose to operate in second-
ary airports, or at old military bases, bringing into the
market airports that had been practically unknown
until then, like Tampere in Finland, or Zaragoza in
Spain.
This has increased the competition between airports
to capture new routes and new passenger flows, while
at the same time there is greater pressure from the
airlines to reduce airport fees.
Airport operators have been forced to come up with
differentiating factors, and the need to pay more
attention to airport marketing is an inescapable reality.
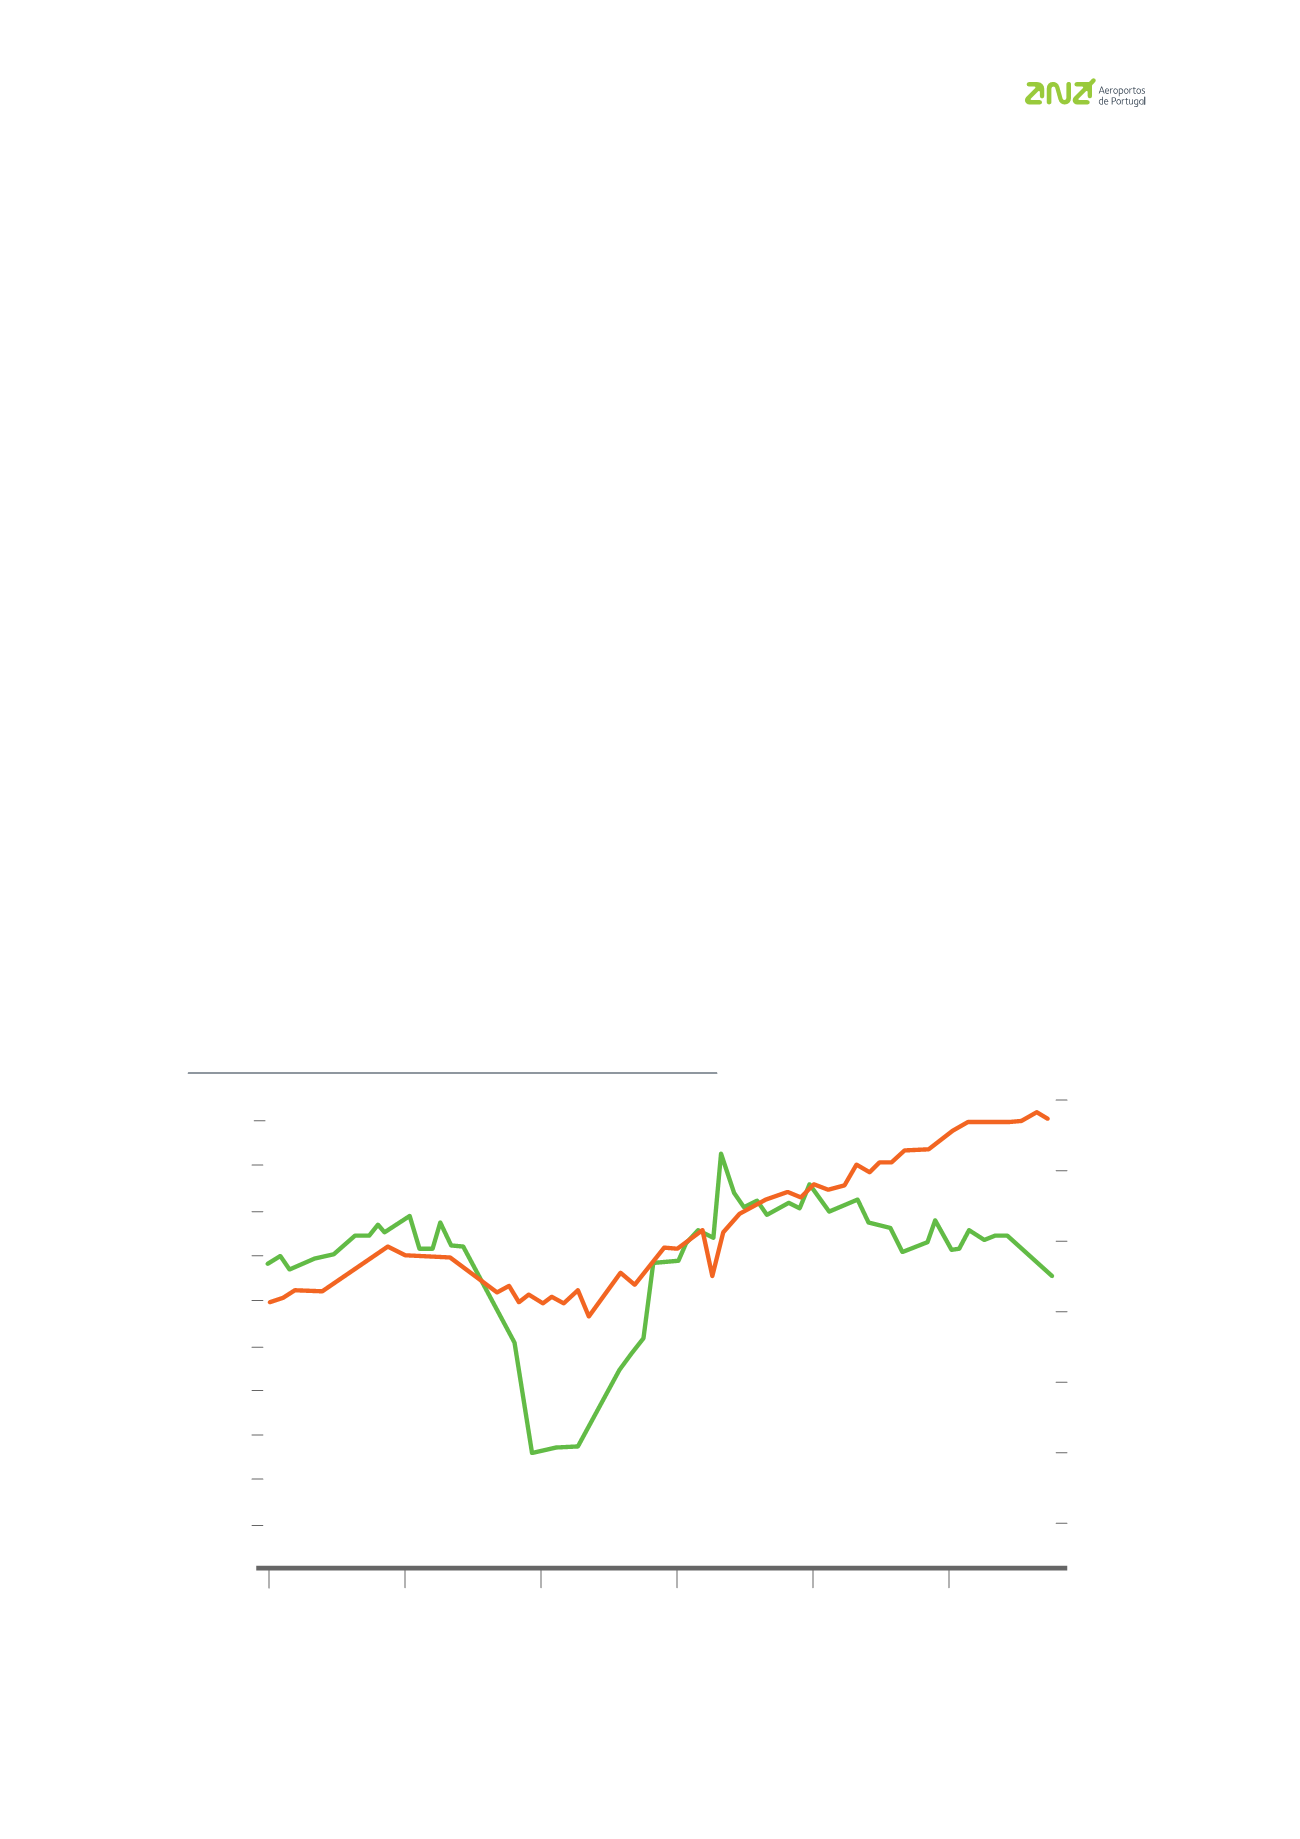
RPKs
FTKs
Source: IATA
450
430
410
390
370
350
330
310
290
270
2007
2010
2009
2008
2011
2012
TOTAL AIR TRAVEL AND AIR FREIGHT VOLUMES – Seasonaly adjusted
RPKs per month (billion)
FTKs per month (billion)
17
16
15
14
13
12
11


