ANNUAL REPORT ‘12
ECONOMIC AND FINANCIAL ANALYSIS
98
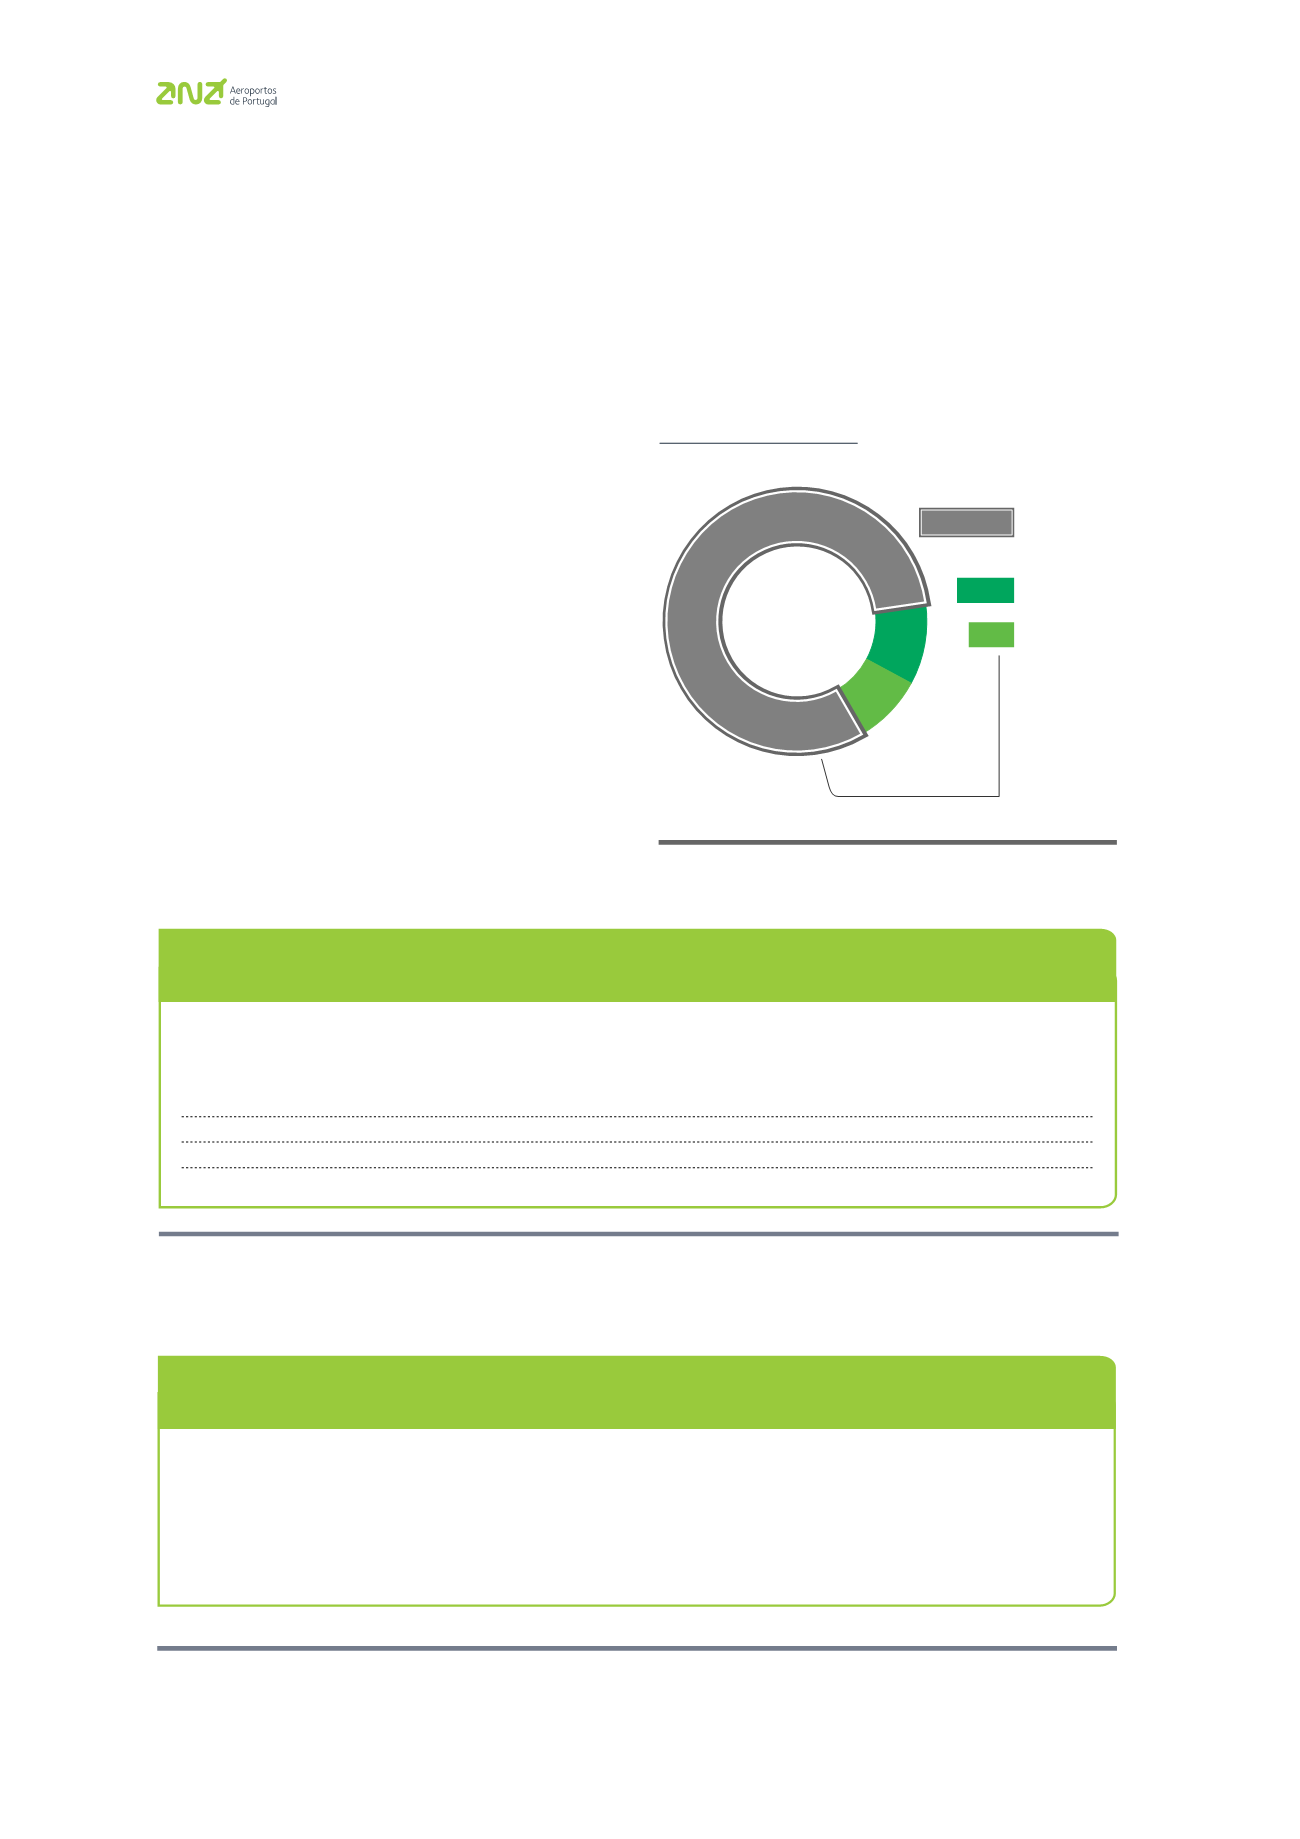
_ANA, S.A.
81.6%
10.1%
_Portway, S.A.
_ANAM, S.A.
8.3%
TURNOVER BY COMPANY
– ANA GROUP 2012
should be noted that the other companies in the Group
also delivered strong growth performances. This is
particularly true of Portway, S.A., which presented
negative results in 2010 and whose net profits in 2012
surpassed 2.6 million euros (see table “Net result”).
Excluding the effect of IFRIC, the net result for the
Group rose by 7.6%.
The operating profits (EBIT) reflect the increase
in turnover generated (4.2 million euros), which
combined with the slight decrease in operating costs,
produces a year-on-year variation of 2.8% (3.4 million
euros). The EBIT margin, in this case, was 27.9%.
The following graph breaks down the contribution of
each company to the Group’s turnover.
ANA, S.A.
45,601
72,340
58,593
(37.0%)
ANAM, S.A.
4,907
4,133
1,010
18.7%
Portway, S.A.
2,688
961
(966)
179.7%
NAER, S.A.
(172)
(909)
(3,032)
(81.1%)
ANA Group
53,024
76,525
55,605
(30.7%)
IFRIC 12 application impact
29,344
0
0
n.a.
ANA Group
82,368
76,525
55,605
7.6%
2010
Net profit
2011
Δ %
12/11
2012
(thousand euros)
Turnover
428,745
424,496
405,841
1.0%
Other operating revenue
13,695
16,515
12,685
(17.1%)
Operating costs
318,981
320,929
324,840
(0.6%)
Operating results (EBIT)
123,459
120,082
93,686
2.8%
Financial results
(8,052)
(16,351)
(17,243)
(50.8%)
Net profit
82,368
76,525
55,605
7.6%
2010
2011
Δ %
12/11
2012
(thousand euros)
ANA GROUP
(1)
(1) For comparative purposes, the Group’s result does not include the impact of the application of IFRIC 12 on ANA, S.A.
ANA GROUP INDICATORS


