ANNUAL REPORT ‘12
ECONOMIC AND FINANCIAL ANALYSIS
106
12.3_ASSETS
12.3.1_ANA Group
The Group’s net asset value rose by 1,160 million euros,
from 1,288.7 million euros in 2011 to 2,448.7 million
euros in 2012. This variation was due to transactions
registered on the parent company’s balance sheet, show-
ing a 1,175.1 million-euro increase. See point 12.3.2.
The Group’s equity capital increased by 26.4 million
euros (+7% year on year).
12.3.2_ANA, S.A.
The net assets for ANA, S.A. in 2012 totalled 2,297.7
million euros, an increase of 1,175 million euros,
reflecting the 1,200 million euros for the initial
concession fee.
Tangible fixed asset values fell by 839.3 million euros,
which were reclassified as intangible assets (concession
right). Under IFRIC 12 rules, the assets of the conces-
sion and their corresponding value were calculated at
the time the Concession Contract was signed and were
reclassified as intangible assets (see graph “Balance
sheet – ANA, S.A.”).
The current assets grew by 44.7 million euros, as a
result of the increase under the headings cash and cash
equivalents (37.2 million euros) and current taxes (8.8
million euros).
Non-current liabilities fell by 152 million euros in
relation to 2011, resulting from the reduction in value
of loans contracted (120.3 million euros) and the
reduction in debts outstanding (31.9 million euros). The
decrease in the loan value is due to a 100 million-euro
bond loan being reclassified as a current liability (to
be repaid in August 2013). The reduction in debts
outstanding reflects the progress in efforts to bring
down the average time for payments, in line with the
Council of Ministers Resolution RCM no. 34/2008, as
amended by order no. 9870/2009 of 13 April.
Besides the reclassified bond loan referred to above,
current liabilities showed a significant increase in
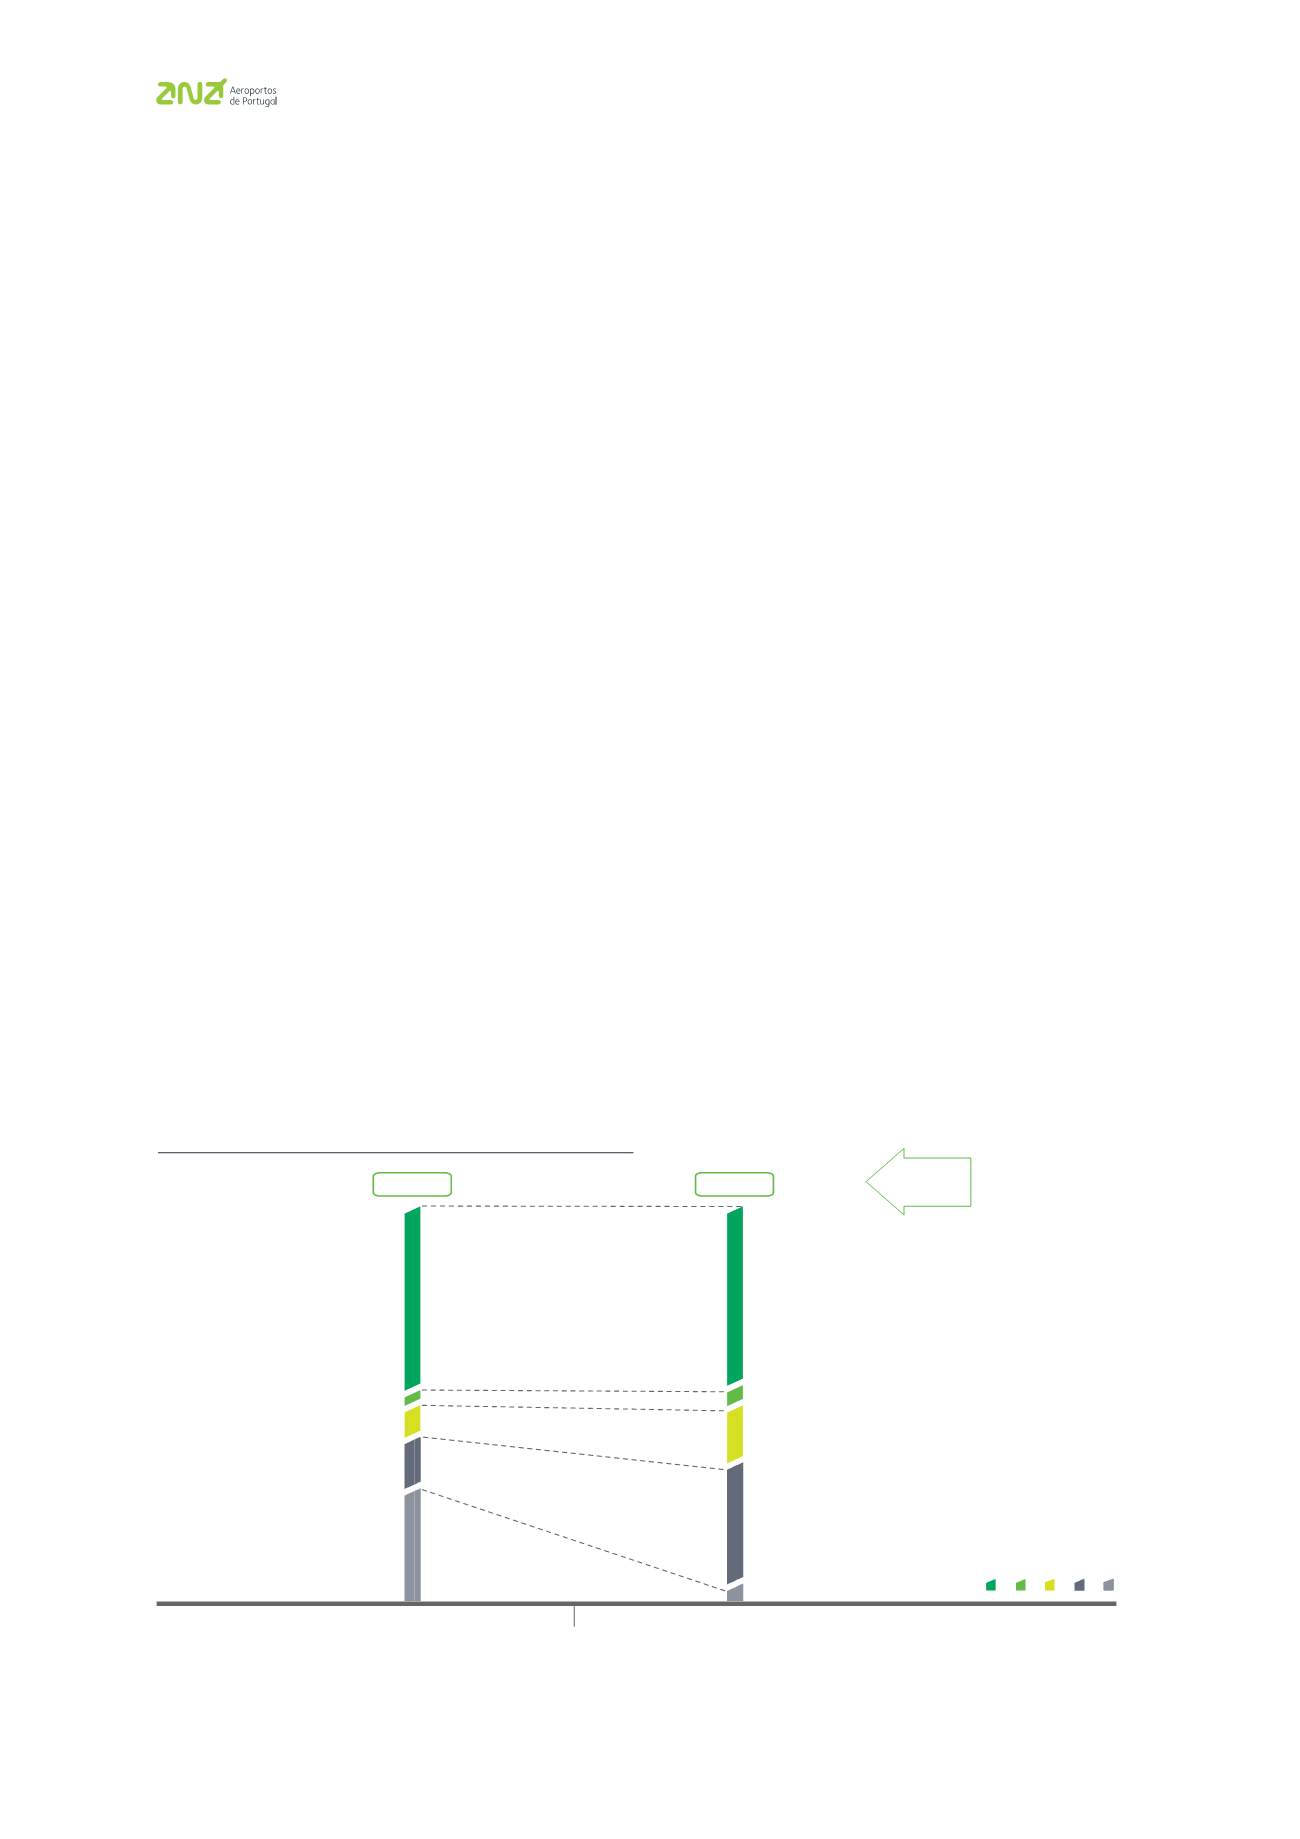
CONSOLIDATED BALANCE SHEET – ANA GROUP
(million euros)
2012
2011
2,275.3
1,161.2
620.9
780.7
1,420.6
127.1
407.2
380.9
173.4
127.5
Non-current assets
Current assets
Equity
Non-current liabilities
Current liabilities
2,448.7
1,288.7
Total
assets
ent l
rurC
ent l
r
Non-cur
E
C
ent a r
Non-cur


